

While driving through Normandy, I was struck by the wackiness of a lot of the local place names. This is amplified by the large linguistic flow through the area, and local dialects that I’m not familiar with, but still felt very silly. For example:

Looking at names like these, I figured that I could make natural-seeming names with something like a Markov chain system. Driving back to Belgium, I was reminded of its strong north/south linguistic divide. This suggested that the name generator should be conditioned on the geographic location. This sounds like a problem for machine learning!
I would like a function that takes in both the spatial coordinates and last N characters of a place name, and returns the probabilities for the next character. Then we can generate the next character, and repeat until we get to the end of the name.
This sort of weird function is perfect for machine learning. To make it work, we need raw data, a chosen method for turning raw data into training data, and a model structure.
The Data
I found a good data set from Geonames, which lists thousands of cities, with their coordinates, country name, population, and more. The names need a tiny bit of cleanup, to remove inappropriate symbols like numbers, but it’s basically ready to use.
First, we need to put the training data into a form that makes sense. How can we pick the first letter of a name? And how do we know when a name is finished? We can define two special characters: % means that the name hasn’t started, and # means that the name is finished. Then we can pad the name with these. So for “Paris”, with N=3 input characters, we change it to “%%%Paris#”. Then the possible (input,output) strings from this name are (%%%,P), (%%P,a), (%Pa,r), (Par,i), (ari,s), (ris,#).
Next, we need to deal with the coordinates. Latitude and longitude aren’t the best choice, as these unwrap the globe into a plane, and have discontinuities at the edges. Simpler is to convert to spherical coordinates, with a radius of 1 for simplicity, and feed the generator with the (x,y,z) coordinates of the city. This is continuous all over the sphere, and even lets us ask stupid questions, such as the name of the city at the center of the Earth!
For training the model, how should we choose a subset of the data? The simplest option is to list every (input,output) pair for all the cities, and use that. The simplicity is appealing, but this would give too much weight to cities with long names, and regions with many cities. What I want is an output that describes what a name looks like for each region. This means that I need to pick cities in proportion to the land area they represent. I can estimate the land area as being proportional to the square of the average distance to the nearest M cities. Luckily, scipy’s KDTree makes this very easy. Then once I have a city chosen with the proper probability, I can randomly pick one of its (input,output) string pairs, and add that to the training data. Repeat many times, and you have a good training data set.
The Model
How do we actually build this function? Since characters are categorical features, the last N characters will be entered using one-hot encoding, and the coordinates will be a 3-vector.
I’ll build a model in Keras. For the characters, I’ll use an LSTM because they are magical for sequences, and it allows flexibility in how many characters to include. Then I’ll concatenate the output of the LSTM to the input coordinates, and run the result through a multilayer dense network. Finally, the output is passed through the soft-max function, yielding the next-character probabilities.
But what if that’s a bad model? As an alternate version, I’ll just concatenate the coordinates and one-hot vectors for the characters, making one long input vector. Then it’ll go through dense layers and output a soft-max.
Now we have all the parts! I’ll train it with a cross-entropy loss function, since we’re messing with probabilities, and now we have a function! Unfortunately, the result is just a vector of probabilities, so we need to pretty it up.
Generating Names
How exactly do we use this to generate names? Well, we start with ‘%%%’, get the probabilities for the next character, and pick one based on those probabilities. If the new character is ‘Q’, then repeat with input ‘%%Q’, etc. This works well, but could be improved, so let’s add another factor to make weirder or more boring names. With probability vector p and temperature T, the new probability is
p_{fun} = \frac{\exp(\log(p)/T) }{\sum(\exp(\log(p)/T)) } .
This is called temperature sampling: a modification of the soft-max function. Zero temperature make the most probable result certain, and infinitely high temperatures make all results equally probable. When T=1, this is the initial probabilities.
The T=0 case is interesting to show spatial variation of the algorithm. The T=1 case should generate natural-ish names, and T=2 should be stupid.
Good! Names! But it’s boring to just look at names when this is describing a location-dependent system. So let’s make maps.
Making Maps
How should we choose where to put cities, and how do we render the city locations, names, and land?
My first attempt was to use the most populous cities, but those are often clumped together in metropolitan areas, so the names overlapped a lot. I found a very useful library, adjustText, which optimizes the placement of labels in matplotlib. This made a huge difference, but still wasn’t a full solution.
To ease the labeling problem, I decided to find a set of cities that are as far as possible from each other. This is essentially a farthest-first traversal, and so was easy to implement.
Then to render the land, I’ll just draw the locations of all cities as light dots, and the labeled cities with larger, darker dots.
Results
First, let’s try with just the UK and France. Oh look, silly names! The first of these maps shows the original city names, and the other shows the ML-generated names.
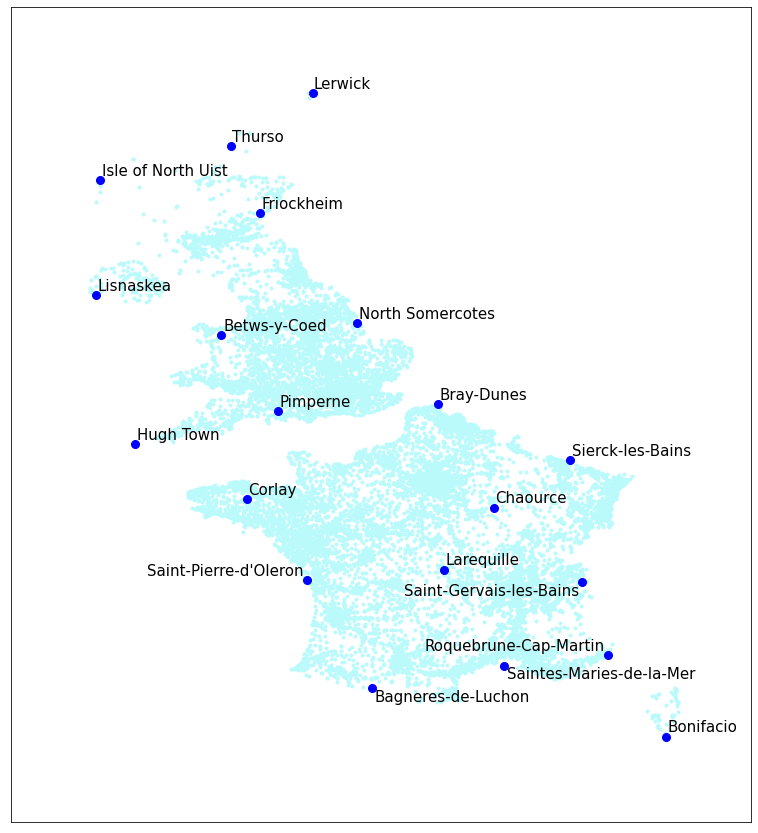
Original names 
Generated names
It’s really helpful that the original names are very silly.
I’ll try another run of these, and vary the temperature level. These are generated for T = 0, 0.5, 1.0, and 2.0.

T = 0.0. Shows regional variation. 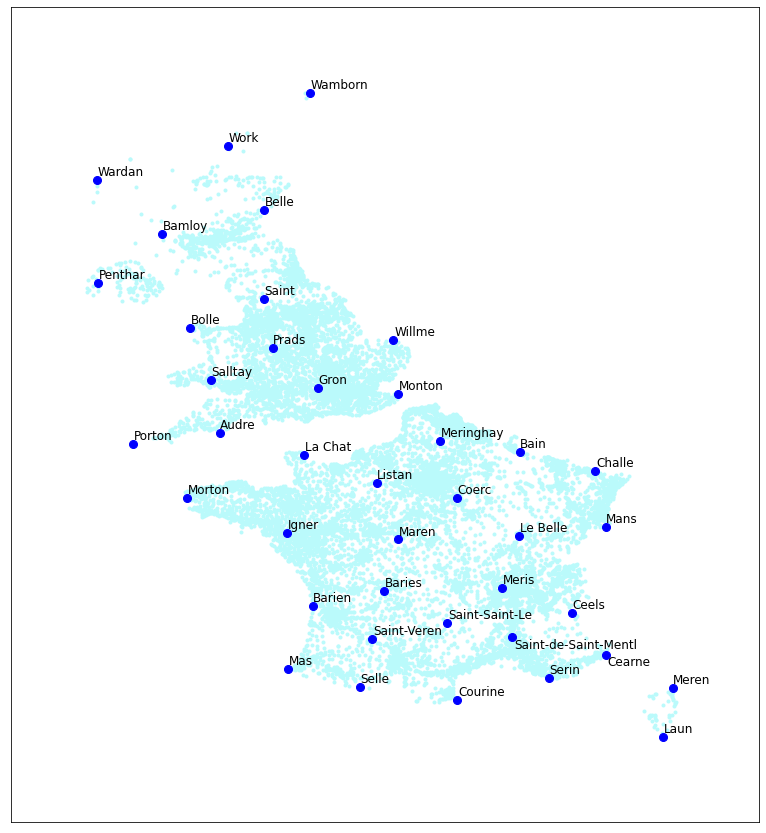
T = 0.5. These seem reasonable. 
T = 1.0. Getting too silly. 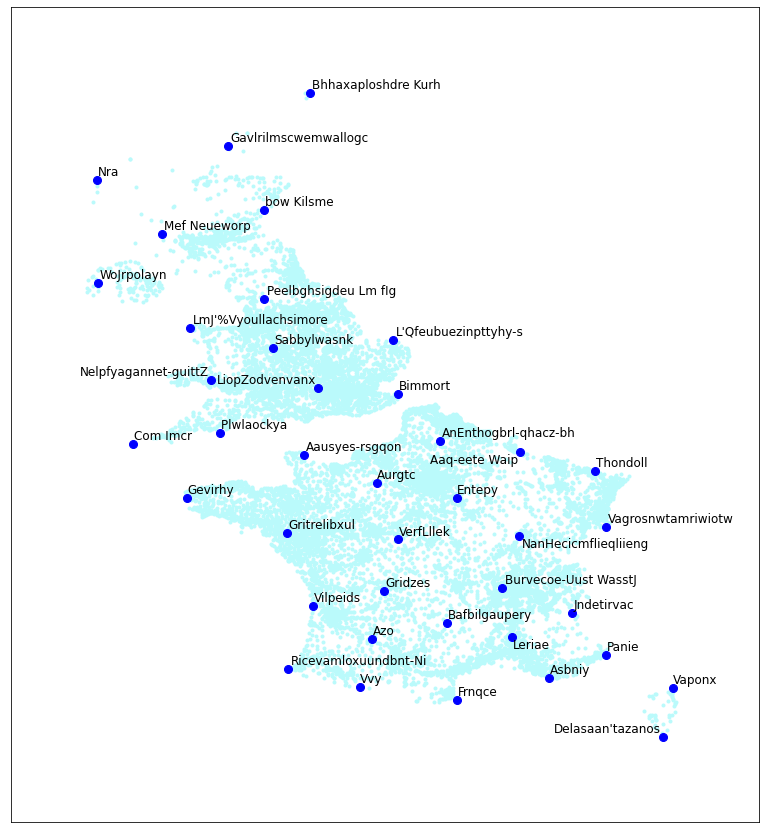
T = 2.0. Gibberish.
As expected, the T=0 case shows that there are few linguistic regions. “Calle” in the south, blending up to “Challe” a little ways past the channel. Then various British “B”-names, ending in “Wille” way up at the top. They don’t look like good names, though. The T=0.5 setting works well, in contrast. Some get excessively French, however, like “Saint-Saint-Le.” Then with T=1.0 and 2.0, it’s just bad: too far from reality.
How about Belgium? It should change from Dutch names in the north to French names in the south.

Fake names 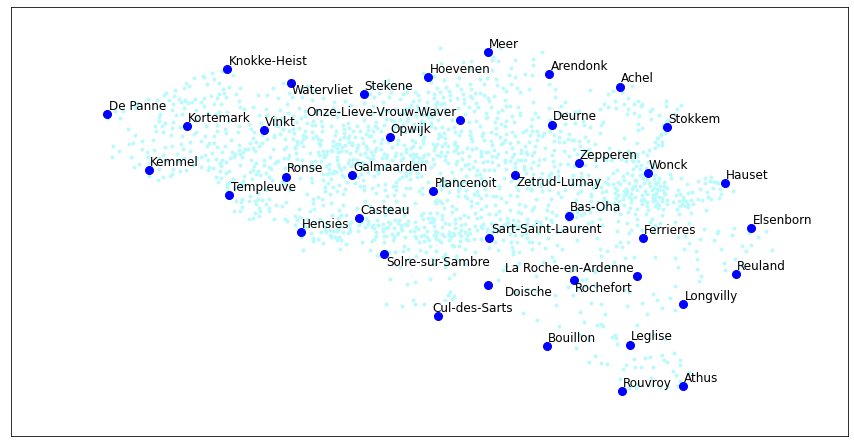
Real names
It mostly works. The names are generally shorter than the real ones, but that could be fixable by increasing the length of the input.
Overall, a success! This system learns to make coordinate-based guesses for city names. This is the magic of machine learning: turn anything into an input/output function, and adjust parameters until it kinda works!