
With a jagged or noisy signal, Fourier filtering can be pretty useful for cleaning up the unwanted noise. Line drawings can be considered signals just as easily as time-varying signals, so let’s get ready for some Fourier transforms!
The basic idea of smoothing (with length scale L) a polyline with a Fourier transform:
- Re-sample along the polyline to have points that are uniform spaced (with distance dL) along its length.
- Take an FFT of the x and y coordinates separately (yielding X, Y).
- Zero-out the portions of X and Y at frequencies higher than 1/L
- Inverse Fourier transform the new versions of X and Y, yielding the smoothed coordinates.
Simple, right? Well, mostly. This assumes that the polyline is a loop, since the Fourier transform assumes a periodic input. The first row of the next image shows what happens when you use this smoothing on a closed loop. The second row tries the naive smoothing on an open shape, and wrongly tries to close it! The third row shows the corrected version, which I’ll explain shortly.
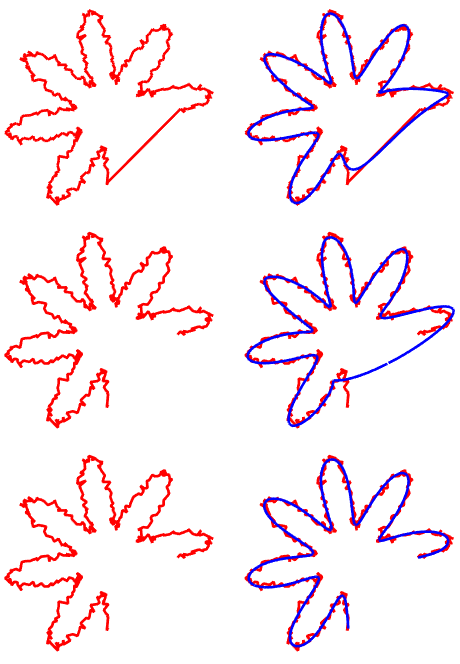
Since the Fourier transform assumes periodicity, it assumes that the start point is right next to the end point. To fix that, we need to “pad” the input. The simplest method would be to prepend (add to the start) a bunch of entries of the initial position, and to append a bunch of entries of the end position. This gives OK results, but doesn’t match the slope of the lines at the end. Instead, we can treat the path as locally odd at the start and end, and connect them into a loop. Then after filtering, we trim off the padding and give a nice smooth result. The padding for the above filtering is shown below, with the original path in black.

2 replies on “FFT-based Line Smoothing”
Nice work.
I have couple of questions:
1. for the IFFT, did you only use the real part of X and Y?
2. for the frequency cut off, the highest frequency should L in Fourier space, right?
Do you have the example code somewhere that I can take a look?
Thanks
Thanks!
1. I used the complex parts of X and Y. Otherwise we’d discard the phase information and get strange changes in the paths.
2. Since I’m using spatial frequencies, it’s 1/length, so the maximum frequency is 1/L in Fourier space.
Here’s the MATLAB code that I wrote. It takes input points arrays x1 and x2:
X1 = fft(x1);
Y1 = fft(y1);
fMax = 1/LSmooth;
N = numel(x1);
fs = 1/dsOut;
N_2 = ceil(N/2);
fax_Hz = ([0 : N-1]-N_2)*fs/N;
freqs = fftshift(fax_Hz);
X2 = X1.*(abs(freqs)